Movement Lifespans as Determined by the Style Number Data
A quick word about the Style Number Dating Method that was developed by Barry Cooper (Gruen watch expert, especially the early years) and myself. I see it being used more over time, by eBay sellers that have no issue, when asked, with stating how they got their exact dates for their watches that they had no other data for, by live auction houses, by internet watch stores. And, it's also getting a lot of use! I'm gaining confidence that it works really well.
For this reference article on Movement Lifespans, it's something rather exciting, new and novel for me. While Barry and I were working on the Style Number Dating Method articles, I started toying with data mining and charting data that displayed some of the data as we discovered it. Movement lifespans were of particular interest. I've not seen any documentation produced that told when movements began production and when they were used in their last watch. The early work showed when a caliber started being produced, but stopped there, and it didn't have many of the movements.
While I have a lot of confidence in our data when it's being used to determine the date of a single watch, I'm not quite as confident for it's use in these charts. I already know that there are cases when it shows a movement beginning manufacturing too early. This happens in the "movement migration" situation described in the article. The ending date I have a bit more confidence in.
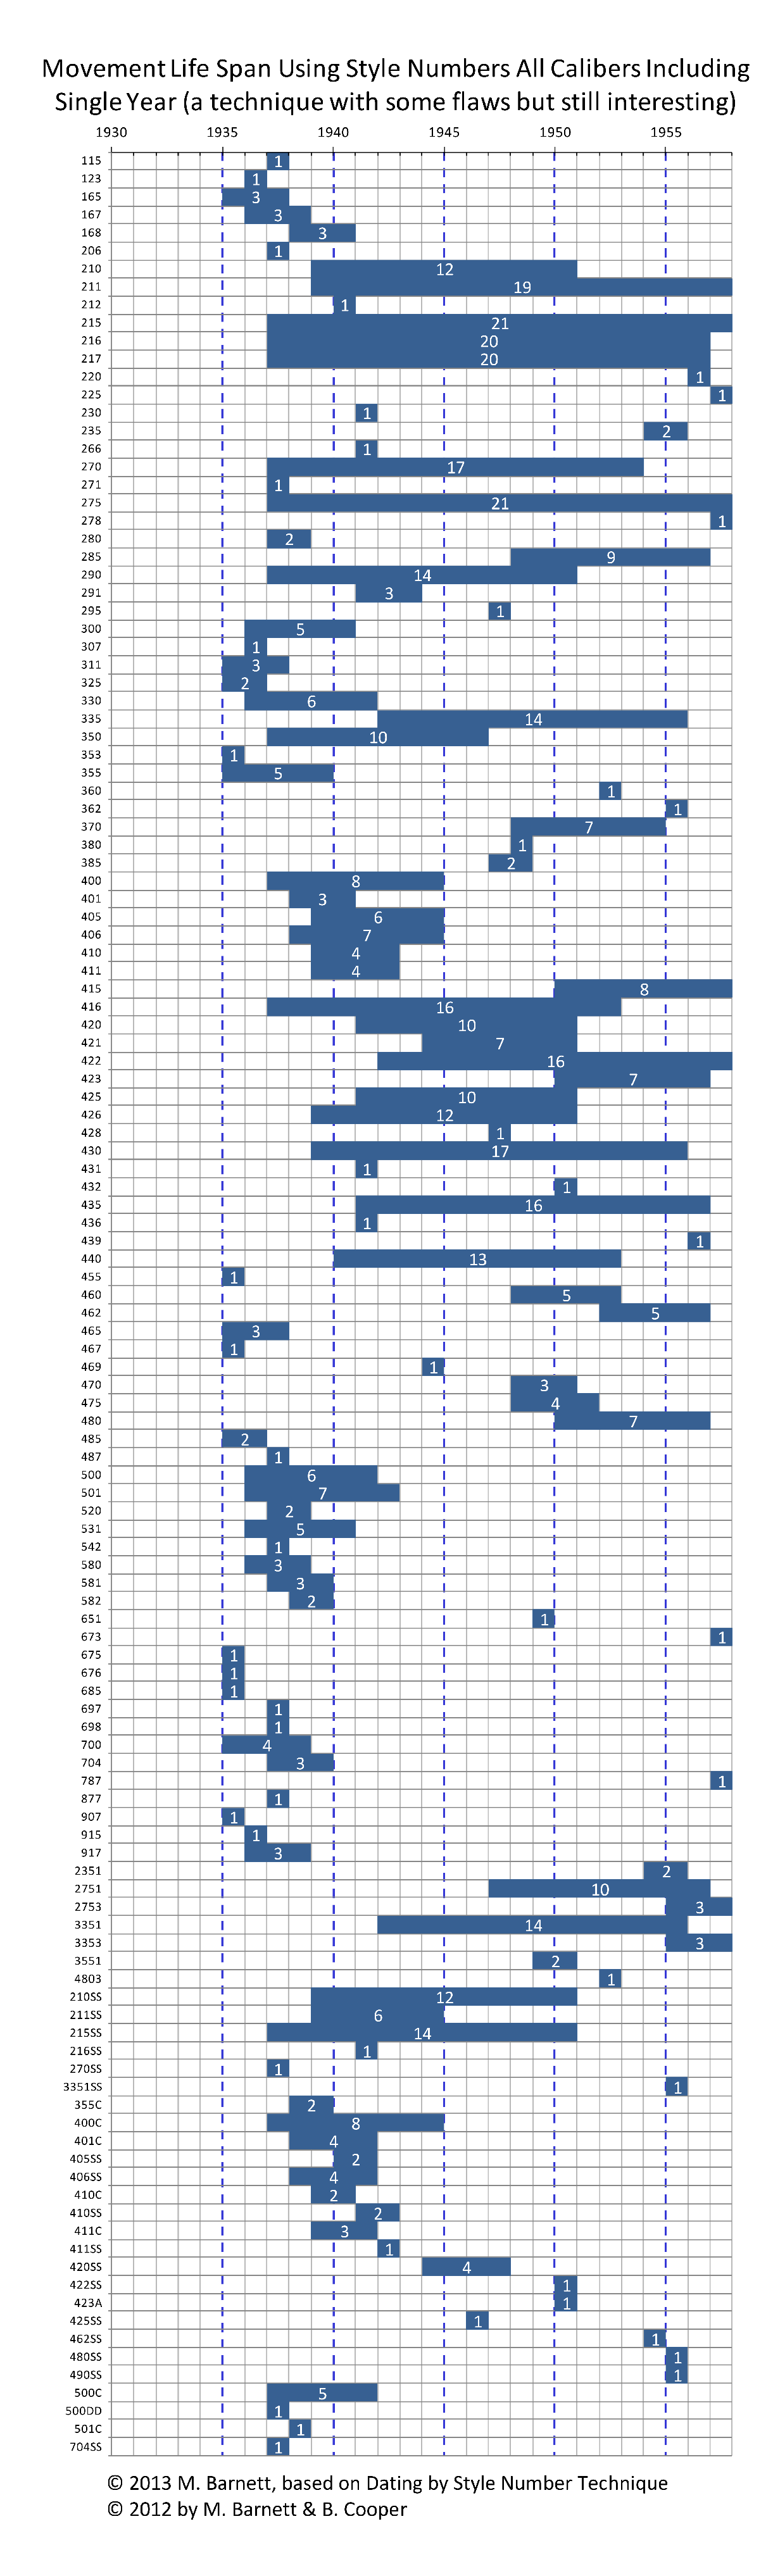
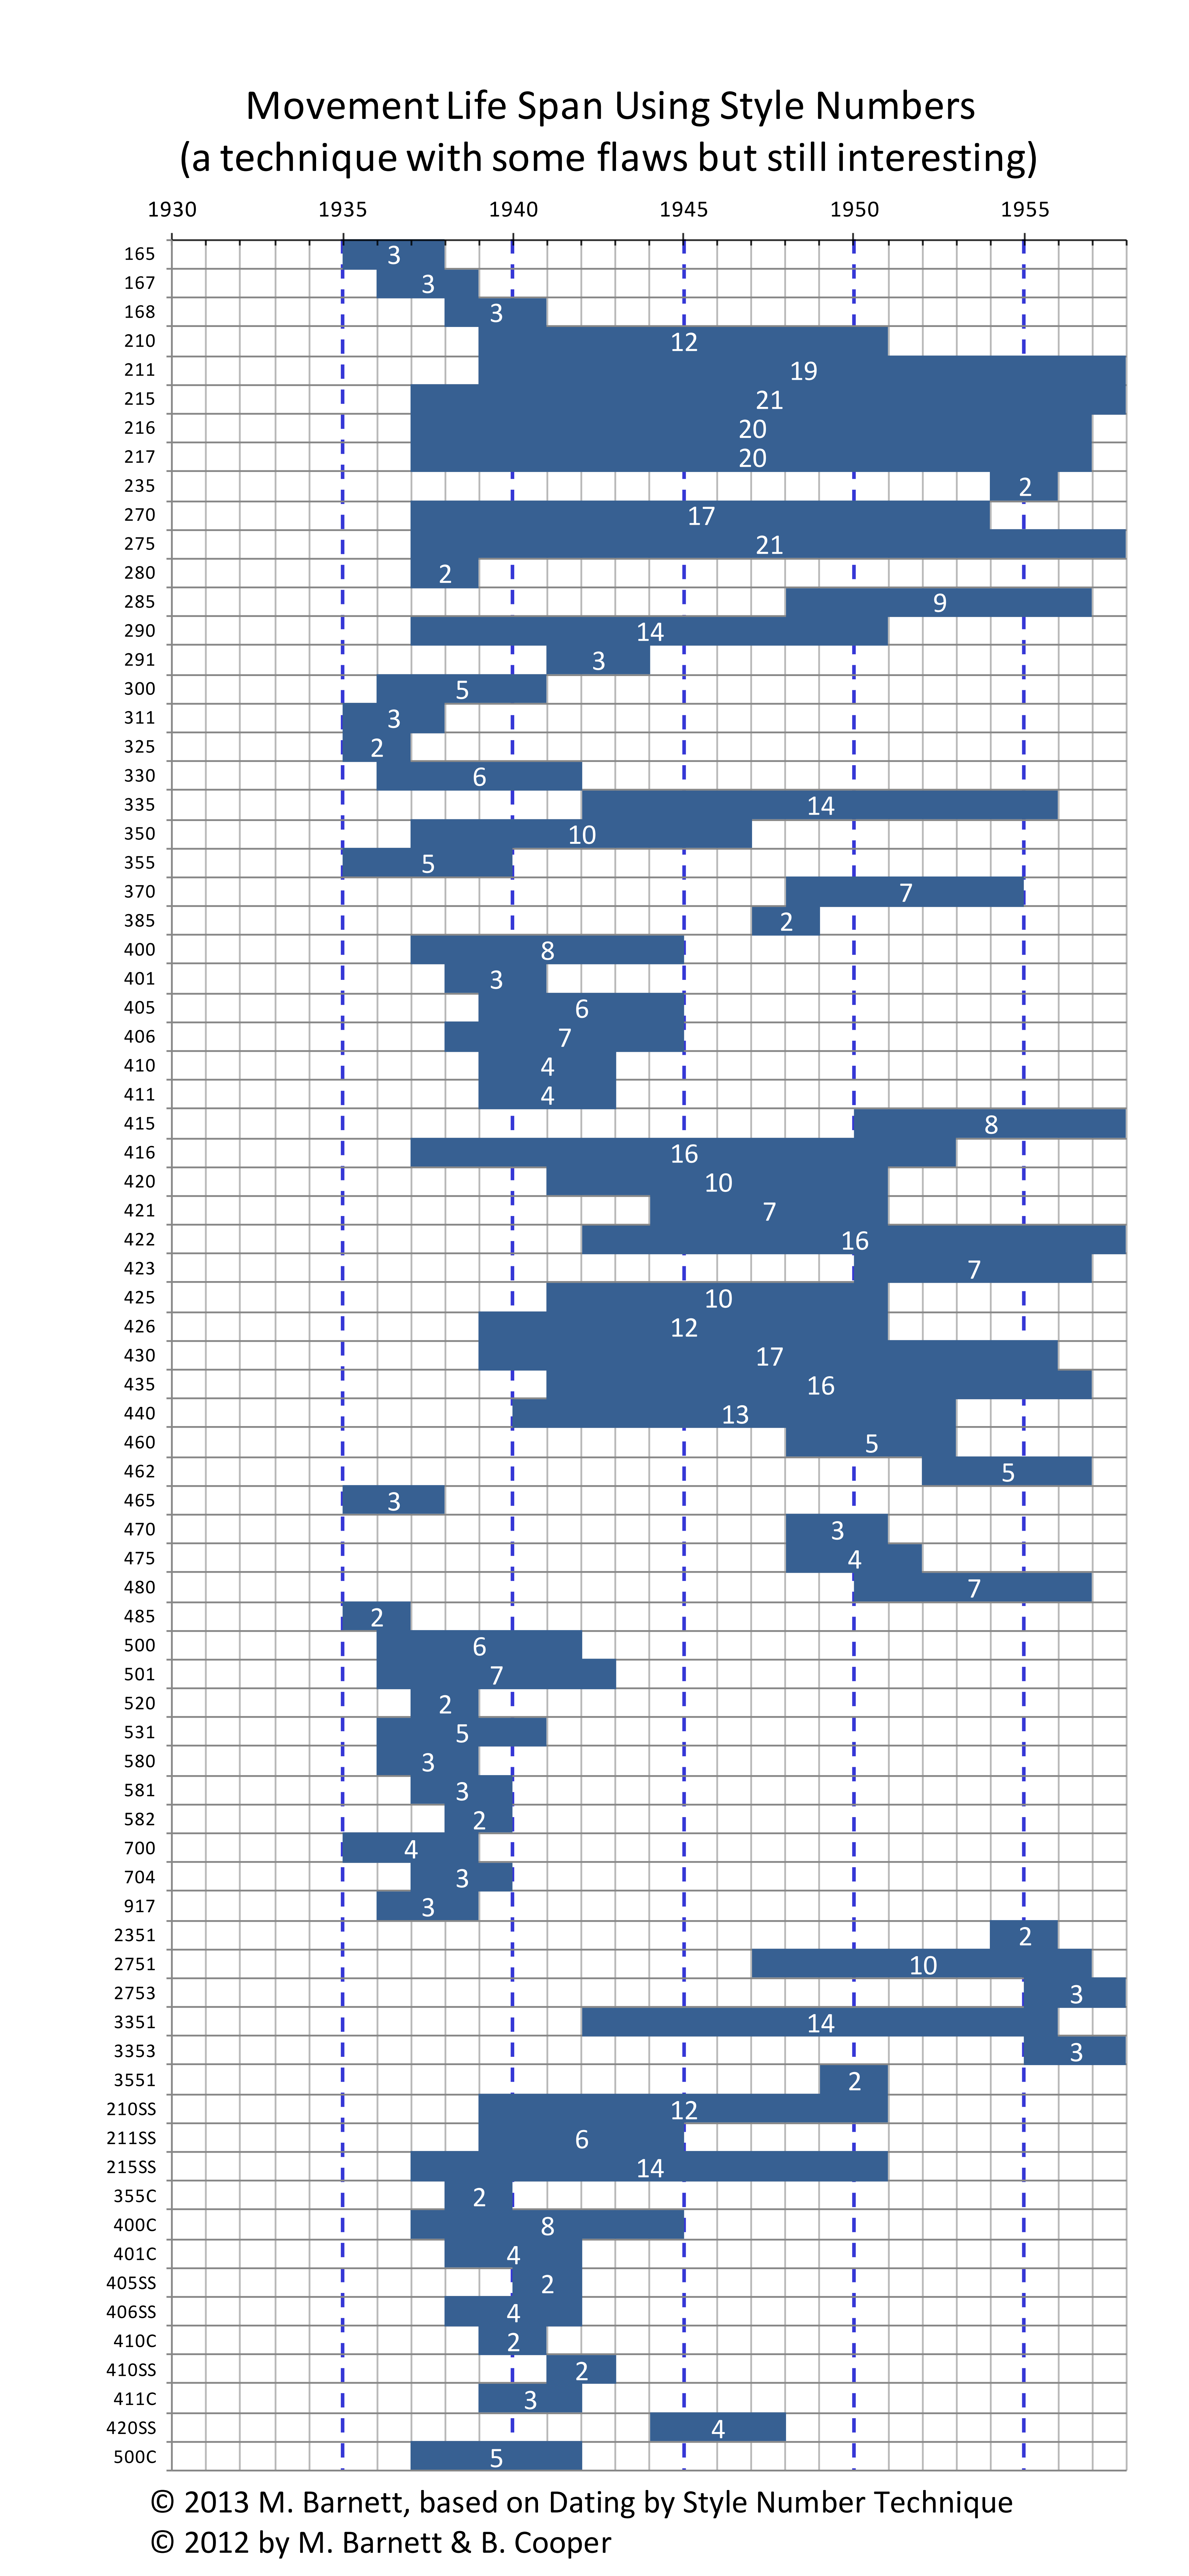
There are two graphs here. One shows a list of all of the movements found during our work, that spanned two or more years of watches. The other graph has all movements shown, even those with only 1 year of production as measured using the Style Numbers.
The way the graphs were created is simplistic. The lowest Style Number found with a caliber is used to find that caliber's starting year. Similarly, the highest Style Number found to be used by a caliber is used to find that calibers ending year. On the graph this time period is represented by a bar drawn horizontally across the graph. The number, in white, in the middle of that bar is the number of years the bar represents (i.e. if you take the high date and subtract the low date). In theory this tells us the lifespan that a specific caliber of movement was being put into watches. But, in practice it's not quite that easy. Even with some errors, just like the Style Number Dating Method, I believe these charts have real value. Enjoy!
The charts shown on the webpage are for online reading. At the end of the page, you'll find links to download the PNG files used to create them. PNGs were needed to keep the resolution up (you'll understand after downloading them :-)

You can download the images of the above graphs if you would like to use them offline
No re-use implied nor granted. Simply ask should you wish to add it to your website.

|
Gruen Caliber Longevity - All Calibers.png Size : 1640.016 Kb Type : png |
|
|
Gruen Caliber Longevity - Multiple Year Calibers.png Size : 1058.945 Kb Type : png |